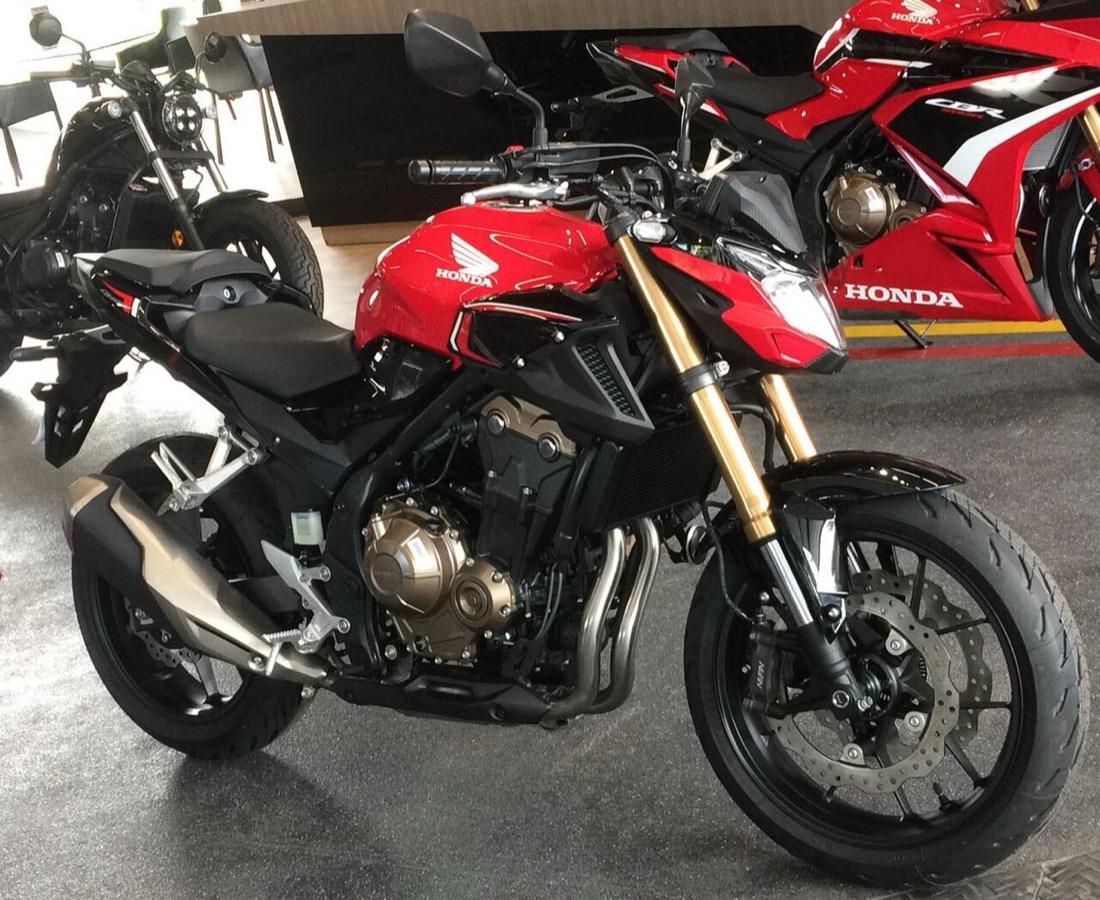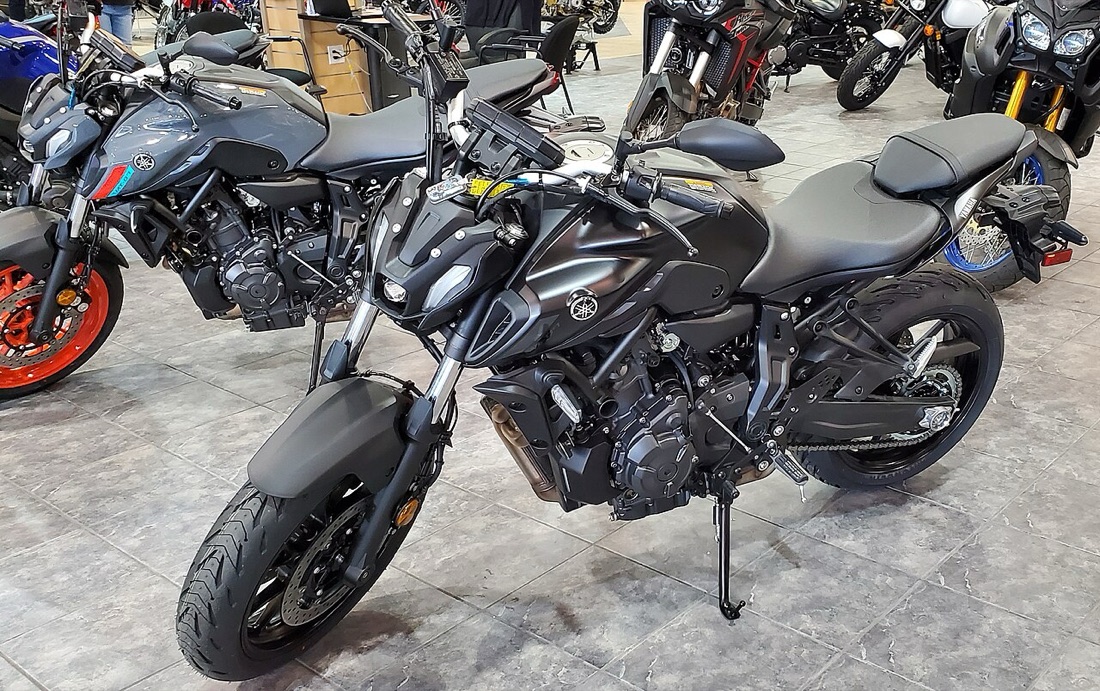
Two Yamaha MT-07s from the same year, with the same mileage, can be advertised £1,300 apart. One sells in ten days, the other sits for three months. That is almost never down to luck: a bike's value is built on five variables, and most sellers only have a grip on two of them.
Here is how the calculation actually works, and how to run it again for your own machine.
1. The reference list price
Everything starts from the model's list price, in its exact trim and model year. That is already where half of all estimates go off the rails: people take the price of the higher-spec version, or next year's price after a price rise.
The list price that matters is the on-the-road price for the year of first registration, factory options included. Accessories fitted afterwards do not belong in that base — they come in later, and count far less than people imagine.
2. The depreciation curve
Depreciation is not linear. On the British market, the order of magnitude for a mass-market motorcycle:
| Age | Indicative cumulative loss | Loss over the year |
|---|---|---|
| 1 year | 20 to 30 % | 20 to 30 % |
| 2 years | 30 to 38 % | 8 to 12 % |
| 3 years | 37 to 45 % | 6 to 9 % |
| 5 years | 48 to 58 % | 5 to 7 % |
| 8 years | 60 to 70 % | 3 to 5 % |
| 12 years and over | Floor | Close to zero |
Two lessons here. First, the opening year weighs as much as the following three put together: buying a one-year-old bike means letting somebody else pay for a quarter of the machine. Second, there is a floor: past ten years or so, a well-maintained bike barely loses anything more, and some models climb back up.
That floor depends heavily on the segment. A mass-market adventure bike settles higher than a sports bike from the same era, whose price stays pulled down by an assumed harder life.
3. Mileage
Mileage is corrected against a yearly benchmark for the segment, never in absolute terms. A five-year-old roadster on 30,000 km is right in the norm; a cruiser of the same age on the same mileage is well above its typical use.
Benchmark annual mileage, orders of magnitude:
- Roadster / sports bike: 5,000 to 7,000 km per year
- Adventure / touring: 8,000 to 12,000 km per year
- Cruiser: 3,000 to 5,000 km per year
- Urban scooter: 6,000 to 10,000 km per year
The gap to the benchmark converts into pounds, on a scale that depends on the price of the machine — somewhere around £20 to £50 per 1,000 km depending on the segment. The correction is capped: below a certain threshold, very low mileage becomes suspicious rather than valuable, because it points to a long lay-up, dried-out seals and stale fuel.
4. Real demand — the factor everyone forgets
This is the variable that explains the gaps age and mileage cannot. A sought-after model sells for more and sells faster, whatever its objective qualities.
What holds demand up:
- A2 compatibility: on the British market, a model that can be restricted to A2 has a far bigger pool of potential buyers.
- Parts availability and the density of the dealer network.
- The engine's reputation for reliability, including when that reputation is partly folklore.
- Run-out status: a discontinued model whose value stabilises, or even climbs back.
The other way round, a machine known for expensive servicing, a thin dealer network or pricey wear parts drops faster than its theoretical curve — the buyer prices the cost of ownership into what they are willing to pay.